
What a Purity Method Shows
A purity figure is only as good as the instrument that produced it. High Performance Liquid Chromatography (HPLC) and Ultra Performance Liquid Chromatography (UPLC) both measure purity — but UPLC uses smaller particles at far higher pressure, which separates a sample more finely. That means UPLC can resolve trace impurities an HPLC method blends into the main peak, so its purity number is the more rigorous one.
"99% pure" is a claim, not a fact
Almost every research-compound listing carries the same figure: 99% purity. It has become table stakes — so common that it no longer distinguishes anything.
Here is the problem. Purity is not printed on the vial; it is the output of an analytical measurement. Change the measurement and the number changes. The same batch can be reported at two different purities depending on how carefully the analysis separates the target compound from everything else in the tube. So the honest question is never just "how pure is it?" — it is "purity, measured how?"
That is where liquid chromatography comes in, and where two closely related methods — HPLC and UPLC — quietly part ways.
What chromatography actually does
Liquid chromatography answers one question: what is in this sample, and in what proportion? A dissolved sample is pushed by a high-pressure pump through a column — a tube packed with microscopic particles. Different molecules travel through that packing at different speeds, so the components of a mixture arrive at the far end separated in time. A detector records each one as it exits, drawing a trace of peaks.[1]
The area under each peak is proportional to how much of that component is present. Purity, in this world, is simply the area of the target peak as a percentage of all the peaks. A clean separation gives a trustworthy percentage. A blurry one does not — and that is precisely the axis on which UPLC and HPLC differ.
UPLC vs HPLC, side by side
UPLC is not a different principle — it is HPLC engineered to a finer tolerance. The pivotal change is the size of the particles packed into the column. HPLC columns are packed with particles around 3–5 micrometres across; UPLC uses sub-2 micrometre particles, commonly about 1.7 µm.[2] Smaller particles separate a mixture more efficiently — but they resist flow, so the system has to run at much higher pressure to push solvent through.
| Parameter | HPLC | UPLC |
|---|---|---|
| Particle size | 3–5 µm | <2 µm (≈1.7) |
| Operating pressure | up to ~400 bar | ~1,000–1,500 bar |
| Separation efficiency | Standard | Higher — more theoretical plates |
| Peak shape | Broader | Narrower, taller |
| Trace-impurity detection | Method-dependent | Often improved |
| Run time | Tens of minutes | Minutes |
| Solvent used per run | Higher | Lower |
Figures describe typical instrument classes; exact values depend on the column, method and hardware. "UPLC" is a trademarked term for the sub-2 µm category; the generic name is UHPLC.
Smaller particles, sharper truth
There is a well-established relationship in chromatography — described decades ago in what is known as the van Deemter equation — showing that smaller packing particles produce more efficient separations across a wider range of flow rates.[1] More efficient separation means each component leaves the column as a narrow, tall peak rather than a broad, low hump.
That sharpness matters. When peaks are broad, two components that exit at nearly the same time can overlap—a small impurity may appear as a shoulder on the main peak. A well-developed UPLC method can pull those neighbours apart and reveal a distinct peak.[2] A well-validated HPLC method can also produce rigorous separation; the chromatogram and validation data decide the result.
Sharper peaks can also improve signal relative to baseline noise, making smaller components easier to measure under suitable conditions. The practical advantage is potential resolution, sensitivity and speed—not an automatic guarantee of a more accurate purity value.
On every tuned batch, purity is reported by UPLC with a batch-specific Certificate of Analysis — see how we test or view a sample CoA.
What to look for on the paperwork
Because the method decides the number, a purity figure is only meaningful when the method is disclosed. When any research-compound purity claim is evaluated, the Certificate of Analysis should answer:
- Which method produced the number — HPLC or UPLC/UHPLC, stated plainly, not just "99%".
- The chromatogram itself — the actual trace, so the peaks can be seen rather than taken on faith.
- Detection wavelength and column — the conditions the separation ran under.
- The batch it belongs to — a purity number is only valid for the lot it was measured on.
A supplier that publishes the method and the trace is inviting scrutiny. That is the point. Purity that cannot be audited is just a bigger font.
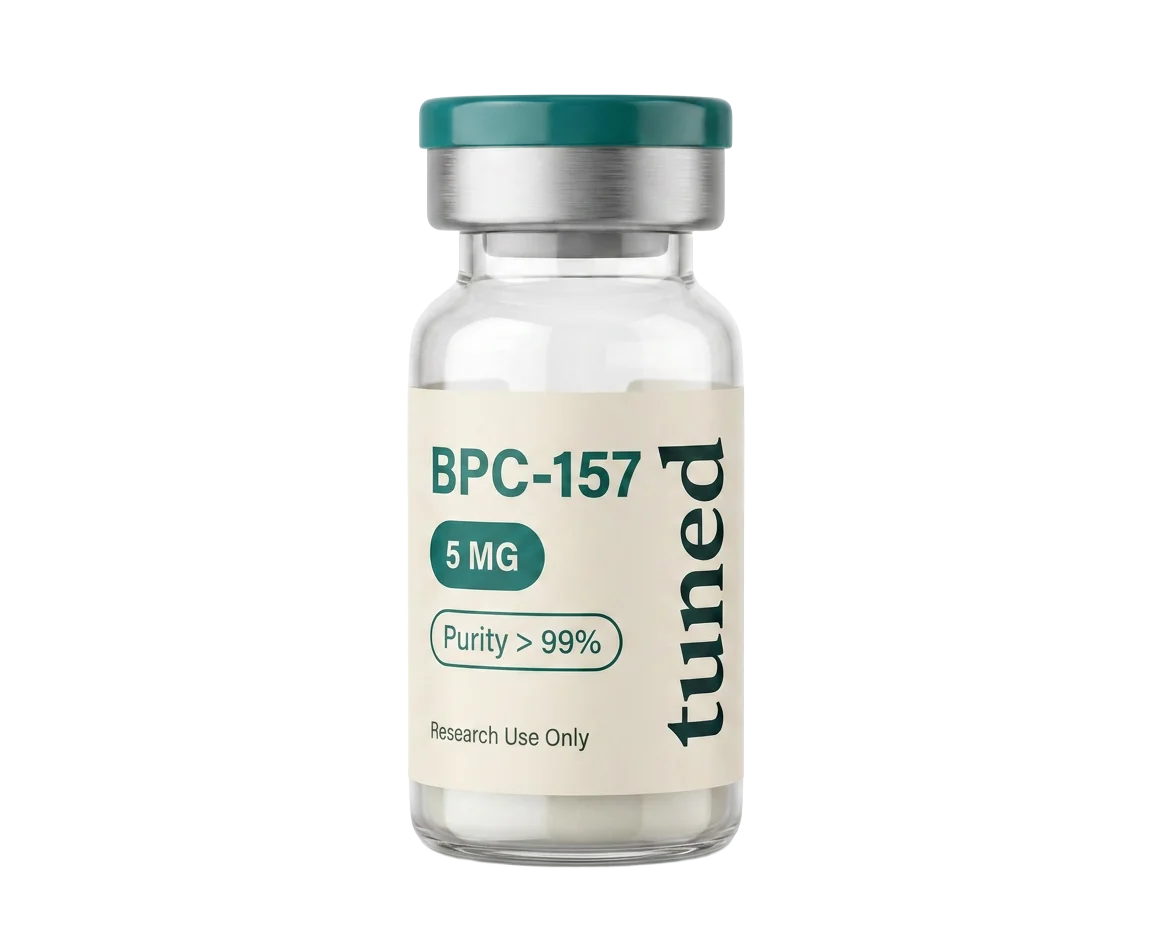
Auditable purity
For laboratory research use only · available to qualified researchers. Not for human or animal consumption.
Same claim, different evidence
"99% pure" says little on its own. Two compounds can carry the identical figure while being tested under different conditions. The methodology is the story: UPLC can offer higher resolution and faster analysis, while a validated HPLC method can also support a rigorous purity result.
The lesson generalises beyond chromatography: in a field where everyone quotes the same statistic, the credible signal is the one that can be inspected. Ask what measured it. Ask to see the trace. The suppliers worth trusting will already have shown their work.
Go deeper
References
- van Deemter JJ, Zuiderweg FJ, Klinkenberg A. Longitudinal diffusion and resistance to mass transfer as causes of nonideality in chromatography. Chemical Engineering Science, 1956;5(6):271–289. (Foundational relationship between particle size and separation efficiency.)
- Swartz ME. UPLC: An Introduction and Review. Journal of Liquid Chromatography & Related Technologies, 2005;28(7–8):1253–1263. (Sub-2 µm particles, elevated pressure, gains in resolution, sensitivity and speed.)
- United States Pharmacopeia, General Chapter <621> Chromatography. (Standard framework for chromatographic purity determination and system suitability.)
This article describes analytical laboratory methods for characterising research compounds. It concerns measurement and quality control only.
For research use only. Not for human or animal consumption. This article is provided for educational and laboratory-reference purposes. It describes analytical chemistry methods and makes no medical claims. tuned products are intended for in-vitro research and laboratory use only.